1 Department of Intelligent information security systems, MIREA—Russian Technological University, 119454 Moscow, Russia; i@dmitryilin.com (D.I.); grottersha123@gmail.com (A.S.); belov_v.a@mail.ru (V.B.); p.pushk@mail.ru (P.P.); alekseenko_a@mirea.ru (A.A.); magomedov_sh@mirea.ru (S.M.)
2 Center for Interdisciplinary research in education, Russian Academy of Education, 119121 Moscow, Russia; pavelkolyasnikov@gmail.com (P.K.); info@digitalpsytools.ru (A.R.); nail_it4@mail.ru (N.L.)
3 Department of Hospital Surgery, Sechenov Moscow State Medical University, 119992 Moscow, Russia; alenkos@rambler.ru
4 Psychological Institute of Russian Academy of Education, 125009 Moscow, Russia; iliazaharov@gmail.com (I.Z.); victoria
Abstract: Web-surveys are one of the most popular forms of primary data collection used for various researches. However, mass surveys involve some challenges. It is required to consider different platforms and browsers, as well as different data transfer rates using connections in different regions of the country. Ensuring guaranteed data delivery in these conditions should determine the right choice of technologies for implementing web-surveys. The paper describes the solution to transfer a questionnaire to the client side in the form of an archive. This technological solution ensures independence from the data transfer rate and the stability of the communication connection with significant survey filling time. The conducted survey benefited the service of education psychologists under the federal Ministry of Education. School psychologists consciously took part in the survey, realizing the importance of their opinion for organizing and improving their professional activities. The desire to answer open-ended questions in detail created a part of the answers in the dataset, where there were several sentences about different aspects of professional activity. An important challenge of the problem is the Russian language, for which there are not as many tools as for the languages more widespread in the world. The survey involved 20,443 school psychologists from all regions of the Russian Federation, both from urban and rural areas. The answers did not contain spam, runaround answers, and so on as evidenced by the average response time. For the surveys, an authoring development tool DigitalPsyTools.ru was used.
Dataset License: CC-BY-4.0.
Keywords: mass web-surveys; LDA; text preprocessing; open questions
1. Summary
Currently, a significant amount of educational and psychological researches use web technologies. This allows them to attract many participants, conducting population and mass research in a short period of time. Much of the research is based on questionnaires [1]. The inclusion of open-ended questions in the questionnaires expands the scope of research and is an unstructured data source with very valuable information, which allows them to obtain additional data for analysis that are not bound by the framework of predetermined answers [2], including additional information about the emotional status.
Digital tools are a modern research tool [3]. The Russian Academy of Education has developed a digital platform for large-scale research, DigitalPsyTools.ru. It is designed to collect and process large amounts of data using web technologies [4], which meets the requirements of the legislation of the Russian Federation for the functioning of information systems. The digital platform is a tool for collecting and storing research data, which are the basis for the formation of methodologies, analytical materials, methodological recommendations at the territorial, regional, and federal levels.
The primary data collection is carried out using web interfaces [5]. Based on surveys in educational institutions, a database [6] is formed, which will become available for analysis to multidisciplinary research groups. Long-term data storage is provided in conjunction with the methods used in the Data Center of the Russian Academy of Education. This will allow the tracking of the dynamics of changes in indicators and their characteristics, to make a selective analysis according to regional characteristics, and to consider the influence of factors on the value of indicators, as well as their change in time.
When conducting a mass web-survey, for tens and hundreds of thousands of participants, each open-ended question gets an almost unique answer, since such questions are not formulated for topics with an unambiguous answer. One of the main tools for processing text responses is intellectual analysis [7]. However, the use of artificial intelligence tools is a significant problem, for the text mining models used are different for each case since each area has a set of specific words with different semantics [8]. For example, the text mining model used to analyze messages on social networks is vastly different from the text mining model used to analyze answers to open-ended questions in a survey [9]. In the analysis of textual answers to open-ended questions, it is necessary to use thematic modeling methods [10] and consider the following tasks: preprocessing a textual database; selection of parameters of the modeling theme; model reliability assessment; adequate interpretation of topics or classes of responses.
In the presented research, thematic modeling was carried out using the LDA (Latent Dirichlet Allocation) method, first described in [11]. This computational analysis method is used to investigate the thematic structure of a collection of text data [12]. The algorithm combines an inductive approach with statistical measurements [13], making it suitable for exploratory and descriptive analysis of open-ended questions.
The results of one of the surveys conducted in schools of the Russian Federation are presented in Section 2. The section also describes the results of thematic modeling. Section 3 describes cross-platform technological solutions that ensure guaranteed data delivery during federal mass surveys and contains a methodology for analyzing the results of mass web-based surveys with open-ended questions, based on using NLP methods and LDA (Latent Dirichlet Allocation). The User Notes section contains step by step instructions for the practical application of the described NLP programs.
2. Data Description
The dataset has a CSV format and can be loaded with Jupyter Notebook or Excel.
The dataset contains 16,854 rows with columns PQ106-Other and PQ614. Each line in the data is a respondent’s answer to a question: “Do you have any responsibilities at school that are not directly related to your psychological activities?” from column PQ106-Other and an answer to the question:, “Do you have suggestions for the development of psychological service in the educational system of your region?” from column PQ614.
The survey involved 20,443 education psychologists in the web-survey from 86 regions.
Two of the 26 questions in the questionnaire with a free-form answer were selected since they had the maximum number of answers:
(1) “Do you have any responsibilities at school that are not directly related to your psychological activities?”—3694 answers.
(2) “Do you have suggestions for the development of psychological service in the educational system of your region?”—16,700 answers.
The application of the developed technique on the survey dataset under consideration gave the following results.
In question (1), after clearing null values, monosyllabic words, and invalid values, the total number of responses was 3694.
In question (2), after clearing null values, monosyllabic words, and invalid values, the number of responses was 16,564.
Data with the id and responses were written to a CSV file for further processing.
After preprocessing of the answers:
- After splitting the answers into separate sentences in question (1), 4980 sentences from 3694 answers were received. For question (2), it was 25,838 sentences from 16,700 answers.
- The data is given in a list format; each word takes its initial form. The length of the stop word dictionary was 644 words for question (1) and 859 words for question (2).
- After applying the algorithm for finding synonyms, a dictionary was generated for question (1), which included 546 word pairs. For question (2), the dictionary amounted to 1865 word pairs. As input, this step receives the preprocessed text. In the word similarity graph available in the Russian Distributional Thesaurus, each word on the right side has a rating indicating the degree of similarity to the word on the left side of the entry. As an acceptable substitution, words with a rating > 0.6 were taken, that is, having a sufficient degree of similarity as applied to the task. Each of the selected words is also reduced to the initial form. As an output, this step provides text with replaced synonym words.
The final dictionary for question (1) was reduced from 3694 to 172 words. For question (2), all numbers and verbs were deleted, but rare words remained with a frequency of 1–2, the final dictionary was reduced from 4943 to 3079 words. The output of the algorithm gives the number of topics and keywords related to these topics. For example, for questions (1) and (2), four and seven topics were highlighted, respectively. Keywords for the first topic for question (1) were: “director”, “lesson”, “deputy”, “leader”, “secretary”, “union”, “service”, “council”, “workload”, “administrator”. Keywords for the first topic for question (2) were: “psychologist”, “rate”, “teacher”, “school”, “quantity”, “hours”, “educational”, “necessary”, “educational”, “psychology”.
When evaluating these topics, the coherence measure for the question was (1) 0.434, and for the question (2) it was 0.657. Such results mean that some of the data did not fit perfectly, but since the keywords separated the meanings from each other and the general meaning was interpreted, this is a good result because the metric value is between 0 and 1.
According to the answers to question (1), it is possible to distinguish the following four groups as an output of the LDA algorithm. The topics print order and keywords are presented in followings:
- Leaders and assistant managers.
- Attendants, educators, and counselors in the camps, librarians.
- Teachers of various educational profiles and tutors of different profiles.
- The duty, educators, and counselors in camps, librarians.
Results of LDA in path “model_len_dict_id_orig_rand_172nmodel_len_dict_172_len_topic_4”, name of JSON (JavaScript Object Notation) file consists of a number of topic and the next one is count of answers.
For group 3, specific employment positions were allocated (showed in Figure 1).
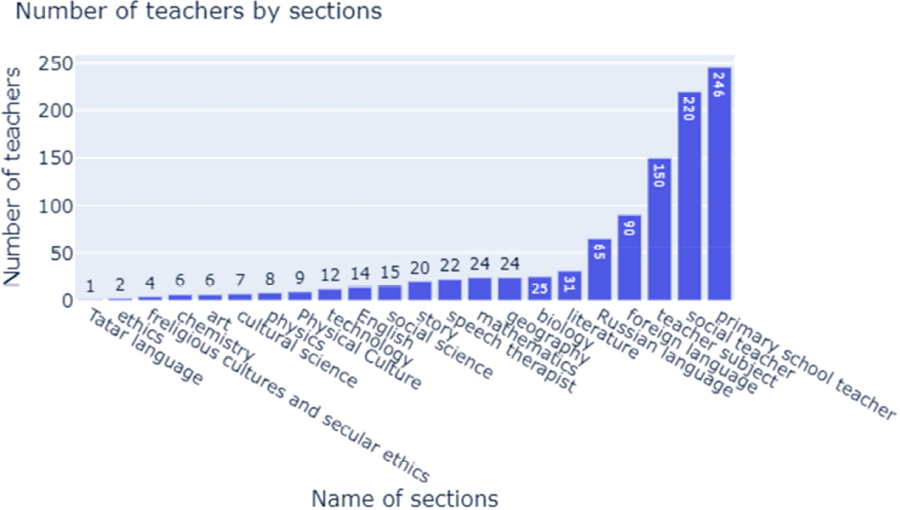
Figure 1. The number of respondents who combine their responsibilities with the section of a teacher-psychologist.
It can be seen, that according to the self-reports by the psychologists there are a substantial number of duties outside of their direct responsibilities. These extra-curricular responsibilities tend to cluster in for repetitive groups. Such a result may indicate that either the list of the psychologist’s duties should be expanded according to their real work responsibilities, or these duties should be addressed by any other members of the school staff directly. One more possibility is to increase the number of roles within the school staff.
By answering the question (2), seven groups were allocated.
- An increase in the number of rates at school and the allocation of hours in the curriculum.
- The creation of centers and the provision of methodological support.
- The increase in salary.
- Conducting training activities.
- Technical equipment of the office and the provision of diagnostic materials.
- General development of the system.
- Creating a unified regulatory framework, documentation, and reporting.
An example of assigning answers to the first group is presented in Table 1.
The results of the analysis of the second question suggest that there is even more room for improvement besides addressing the extra-curricular responsibilities of the psychologists. Thus, among other problems, methodological training and support are needed. Another issue is the number of allocated hours for direct work with students together with underpayment going along with an extensive bureaucratic load by the administration.
Due to the specificity of the task solution, the results can be useful for researchers to conduct professional questionnaires within professional social networks, or in surveys within a corporation to improve management or HR services. The results can be used for web research in the education system using digital platforms.
Table 1. Examples of entries from group 1 “Increase in the number of rates at school and the allocation of hours in the curriculum”.
| Relevance of the Topic | Answer |
| 0.371 | It is necessary to regulate the work of the school psychologist, because with the arrival of children with disabilities in schools, almost all the time allotted for work is reduced for work with these children, and their number increases every year, but nobody canceled the work with other children at school, so working time becomes dimensionless. It is necessary to increase the number of teachers-psychologists at educational institutions working with children with disabilities. Well, increase the salary, because work from morning to evening and the salary is much less than that of teachers. |
| 0.235 | The introduction of correctional and developmental classes with students in the grid of the lesson schedule, as well as the involvement of specialists such as a defectologist and speech therapist in the public educational institution. |
| 0.176 | To increase the number of specialists in schools with a population of over 300 people. |
| 0.133 | Providing everything necessary for work, including a separate oce! Reducing the amount of useless paperwork, increasing salaries by 20–30%. |
3. Methods
One of the goals of mass web-surveys is to involve a big number of participants while ensuring data integrity and validity. That sets a high priority for cross-browser features [14] in order to cover most of the available user devices and operating systems. Cross-browser implementation can be achieved by using a compilation of web languages [15,16], CSS preprocessors and postprocessors [17,18], and modular JavaScript systems [19].
Also, it is important to simplify the implementation of questionnaires. As a prerequisite for the transition from the pen and paper approach to the digital one, the implementation of a questionnaire should not require programming skills.
Commonly a questionnaire consists of several parts. The first one is the instructions for the participant. It sets the participant’s goal depending on the research. For example, it may inquire to select answers matching the participant’s best judgment or to mark the degree of the participant’s agreement with the provided theses. A questionnaire also has the main part with the questions presented in various forms, such as input field, multi-line input field (text area), single choice, multiple-choice, dropdown list, input field matrix, single choice matrix, multiple-choice matrix, slider, and date input. The questions may be combined in sequences and displayed with different presets.
The intra-platform questionnaire standard was developed based on the set goals and requirements. It offers the structure [20] for building web interfaces of questionnaires using predefined elements. The elements are tested and ensured to be working in all major browsers and on all major devices. Every type of question is implemented as an independent element. The questionnaire web interface builds up from these elements and follows the order and presets described with the intra-platform standard. Depending on the element preset, it could have various features.
The described approach has an advantage compared to the common development of webpages: the ability to reuse these unified web interface elements to conduct different web-surveys. Another important feature of the standard is that it makes it possible to verify the described questionnaire before the actual survey, which is similar to the linting process [21,22].
The approach makes it possible to develop various questionnaires without the involvement of qualified programmers. It makes the questionnaire development process less time-consuming, which is necessary when conducting a survey within a limited time.
Based on the analysis of functional requirements and limitations related to the survey, the use of the JSON format as an intra-platform presentation was determined [22,23]. JSON Schema tools were used to control the structure of the JSON documents [23,24].
The intra-platform questionnaire standard has the following hierarchy [25]. On the top level, it consists of questionnaire blocks. Each block has one or more pages. Each page consists of elements such as questions and instruction parts. The question is the main element used to collect participant data. The intra-platform standard implies the presence of a basic structure, which is shown in Figure 2. Property descriptions for basic questionnaire structure (every property is required):
(2) content—questionnaire content:
(b) restrictions—device restrictions (i.e., restrict access to portable devices only).

Figure 2. The basic structure of the questionnaire.
The block is a combination of questions with common behavior and display parameters (Figure 3). Block structure includes the following parameters:
(2) presets—block parameters of the questionnaire:
(b) itemsOrder—order of questions presented within the block;
(c) pageWidth—a setting that allows to stretch the questionnaire area to the width of the window: either standard or wide;
(d) showProgressBar—display progress indicator;
(e) showTimer—display of the questionnaire run time indicator;
(f) expectedTime—the expected time to complete the block of questions (in seconds);
(g) previousPageAccess—allowing access to the previous page;
(h) interruptCondition—scale key, reflecting the condition for interruption of the block passing; it fires when the result of the scale calculation becomes “true”.
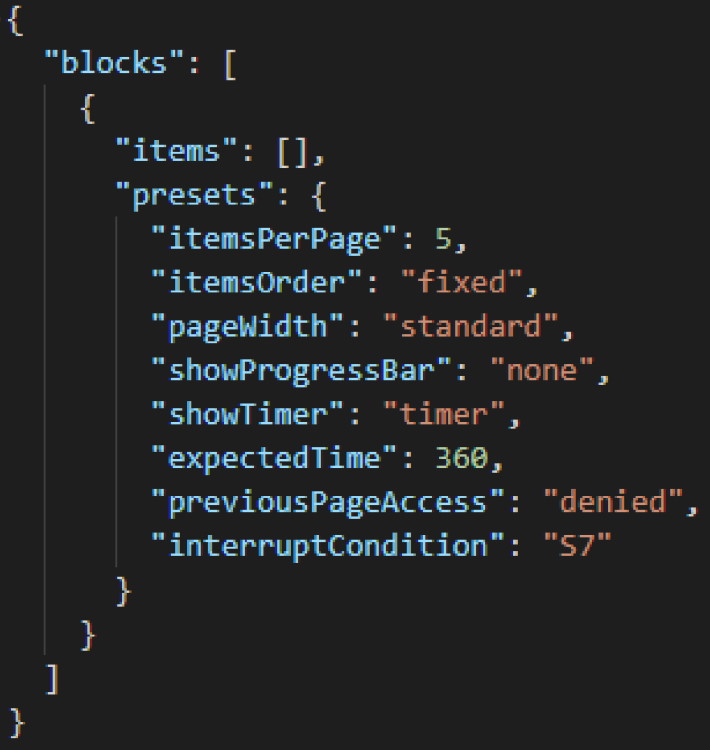
Figure 3. Block structure.
As an example of a specific element description, consider the type of question “input field” and the type of response “string response”. Figure 4 presents the structure of this question using the example of a zip code request.
The structure of the “input field” question includes the following parameters:
(2) variables—values used to refer to the results of answers for organizing calculations:
(b) tags—tags array by which it is allowed to refer to the question answers for calculations in scales;
(b) minLength—minimum allowed string length for input (inclusive);
(c) maxLength—maximum allowed string length for input (inclusive);
(d) format—valid input string format (“any”, “email”, “pattern”);
(e) pattern—regular expression that defines the format of the input string.
Psychological questionnaires, which are compiled using the intra-platform standard, should be uploaded and verified in the DigitalPsyTools.ru. The diagram of this process is presented in Figure 5.
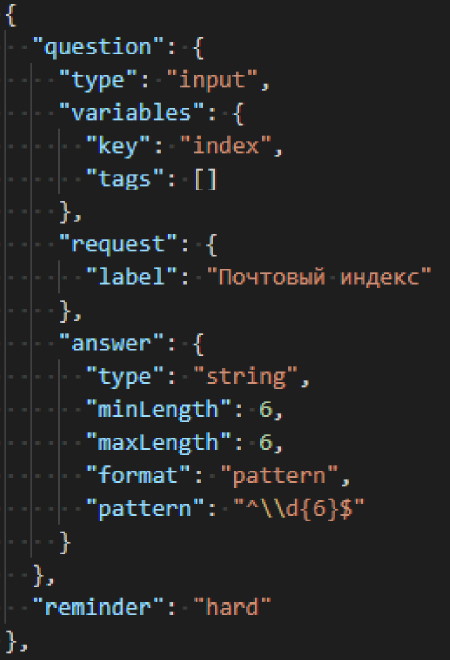
Figure 4. Example of an “input field” question.
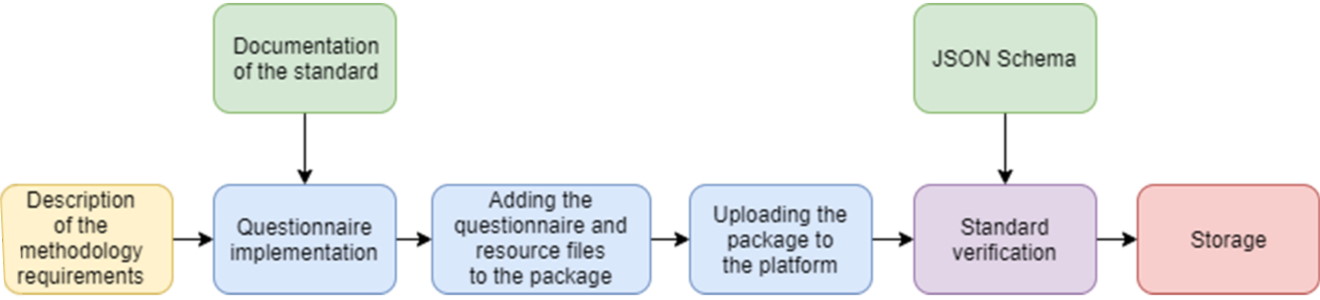
Figure 5. Pipeline of adding a questionnaire to the DigitalPsyTools.ru.
Description of the methodology requirements. It includes all the necessary information, such as a description of the questionnaire, pictures, examples, and other resources that are necessary for the implementation of the questionnaire.
Questionnaire implementation. The description is used for creating a questionnaire based on an intra-platform standard using JSON Schema. The process of questionnaire creation is carried out using the documentation of the standard, which includes a description of all the elements of this standard.
Adding the questionnaire and resource files to the package. After compiling the questionnaire in the specified standard descriptions based on JSON Schema and preparing all the necessary resources, they should be added to the package, which allows the storage and transfer of questionnaire data in a single file.
Uploading the package to the platform. It includes only uploading the prepared package with the questionnaire to the DigitalPsyTools.ru for further action.
Standard verification. At this stage, the package is unpacked to obtain the questionnaire file. After that, the questionnaire is checked for compliance with the JSON Schema (validation stage). If there are any non-standard features, the system will reject the questionnaire.
Storage. After successful verification of the questionnaire for compliance with the JSON Schema, the necessary information about the questionnaire and the package are stored in the data storage system of the DigitalPsyTools.ru.
The process of web interface generation based on the intra-platform standard for conducting psychological research is presented in Figure 6.

Figure 6. Web interface generation pipeline.
Questionnaire package retrieval. The questionnaire package allows the storage and transfer of data in a single file. Thus, all data is available even before the survey start, which is important when using a slow or unstable Internet connection. The package is transmitted over the network. It includes a questionnaire file described using the intra-platform questionnaire description standard based on JSON Schema, as well as all the images and resources necessary for the questionnaire.
Package reading. The package with the questionnaire is unpacked to obtain a file with the structure of the questionnaire and all the necessary resources that will be used in the process of generating the web interface.
Standard compliance verification. For correct web interface generation, it is necessary to check the version of the standard with which the questionnaire was written for compliance with the current version. If the standard version does not correspond to the current one, then the questionnaire file is migrated using the predefined migration scripts. Each migration script describes a strict transition from one version to another. Therefore, if the standard in which the questionnaire is described lags several versions behind the current one, then migration schemes are applied sequentially.
Converting the questionnaire to the internal representation. The questionnaire undergoes semantic analysis with the aim of converting it into an internal representation of the data (classes and objects) that will be used in the web interface generator. It is worth noting that the questionnaire is not checked for compliance with JSON Schema, since it is assumed that it was pre-tested when loading into the psychological platform and is valid.
Web interface generation. The subsystem generates a web interface based on the questionnaire data prepared in the internal representation. The description of the interface elements represents the rules for the individual components of the generated interface according to the questionnaire standard. To generate the interface, web frameworks are used. They specify the logic of the system and are also responsible for the graphic display of components.
Presenting cross-platform web interface. At this step, the web browser receives a fully working version of the interface, which already contains the logic of adaptation for different devices.
Interface adaptation to the specific device. It allows dynamic changing of the display and structure of all interface components for the end device according to the information received from it. In addition, if the size of the browser window is changed on the device, the interface immediately changes the display, size, and position of the elements.
When working with the web interface, it may be required to change the set of elements displayed on one page. To do this, a request is made for a new set of interface components in the generation system.
As a result, the methodology for generating web interfaces based on the intra-platform standard for describing questionnaires consists of the following steps:
– reading and unpacking a package with a questionnaire;
– checking the questionnaire description for compliance with the current standard version;
- if necessary, carrying out the questionnaire migration procedure using appropriate scripts;
- converting the questionnaire to internal data representation
- generating a cross-platform web interface based on the standard in the internal representation using the description of components and web frameworks;
- adapting the display and structure of all interface components to the end device.
The web interface generated on the basis of the intra-platform standard for questionnaire descriptions was tested on different devices, operating systems, and browsers. The approach used is cross-browser [26] and allows the interface to work and display in all popular browsers with a certain adaptation in real-time.
Figure 7 shows a screenshot of the questionnaire dedicated to school psychologists in the web-survey.

Figure 7. An example of a questionnaire interface for school psychologists.
Selected web-based survey tools were integrated into DigitalPsyTools.ru. The results obtained indicate the effectiveness of the selected technologies for conducting federal-level research since all questionnaires were successfully completed without data losses.
The methodology for analyzing the textual data of open-ended questions consists of four stages.
A. Free-form answer preprocessing.
B. Text data analysis and topic modeling.
C. Interpretation of topic modeling.
D. Grouping and use of results.
At stage A, the data are preprocessed and validated. Also, the data are collected, filtered, the text is preliminarily analyzed, the format features of the submitted answers are identified. At stage B, on the basis of the data transferred from stage A, a corpus and a dictionary are created, intelligent algorithms are used to identify patterns and keywords that most accurately identify the identified groups. For topic modeling, the LDA algorithm was used. Stage C interprets the output of the LDA algorithm. For stage D, additional questions were selected, which could be used to group free-form answers by topics from stage C.
For data preprocessing, the following algorithm was developed.
Step 1: It is required to evaluate the degree of answer correctness in terms of semantics and grammar, to identify the parts of speech that are the most and least significant for the subsequent grouping of answers by topic. Then, the “stop words” are selected from the file stop_words.py. These words are the least significant and should be deleted from the text. In this survey, the least significant verbs are those that do not reflect the belonging of the answer to the topics. In this case, blank lines and monosyllabic words were removed. The source data file should be free of extra information. Punctuation marks “.”, “;”, “!”, “?” followed by a capital letter as a separator. Each sentence receives the same id as for the original answer, that is, as a result, it is possible that two or more sentences have one identifier. There may be cases when the answer is entered without following the spelling rules, which will prevent its division into several sentences. Also, there is a case where the sentences are not separated (so the entry may contain multiple meanings). This case is seen as preferable to a complete sentence divided into several parts when the parts will not allow the determination of their meaning.
Step 2: Splitting sentences into tokens, lemmatizing each word, converting words to the initial form with correction of up to two typos, clearing punctuation, stop words, and replacing Russian “ë” (“e” with dots) with “e”. (It should be noted that the allocation in the text stream of minimal fragments for subsequent analysis in corpus linguistics is usually called tokens; lemmatization: definition for all tokens of their initial form—lemmas [27]). Lemmatization is implemented using libraries Az.js (https://github.com/deNULL/Az.js) and pymorphy2 (https://github.com/kmike/pymorphy2), but the list of stop words is taken from packages (https://github.com/stopwords-iso/stopwords-ru) and (https://www.nltk.org/api/nltk.html).
After applying the LDA algorithm in step C, a list of stop words will be added due to the specificity of the data determined in step A.
Step 3: Building a dictionary of correct word replacements using a word similarity graph. For the considered problem, the Russian Distributional Thesaurus is used (https://nlpub.mipt.ru/Russian_Distributional_Thesaurus). Files are presented in DSV (delimiter separated values) format, where each line contains one entry. The entry consists of the left side (word) and the right side (a list of similar words, separated by commas). Each word on the right side has a rating indicating the degree of similarity to the word on the left side of the entry. As an acceptable substitution, words with a rating >0.6 were taken, that is, having a sufficient degree of similarity as applied to the task. Each of the selected words is also reduced to the initial form.
Step 4: Reducing the variety of words used in the answers. Removing unimportant words from the point of view of the task. On the basis of the selected pairs (word + list of words to replace), all similar words are replaced with a single-use case. As the accepted option, the first one found in the text is used. Also, those parts of speech that do not carry valuable information are removed from the sentences (based on the expert assessment obtained in step 1 in step A). For this task, these are verbs, numbers, and some tokens in the Latin alphabet. To apply the algorithm for splitting data into separate groups, it is required to bring it into a vector form. The bag of words model was used [9], the main idea of which is that meaning and similarity are encoded as a vector by the frequencies of occurrence of words in a document. In this coding scheme, each document is represented as a multitude of tokens constituting it, and the counter for the corresponding word serves as the value for each position of the word in the vector. Values can be prime integer counters, as shown in Figure 8, or weighted by the total number of words in the document.
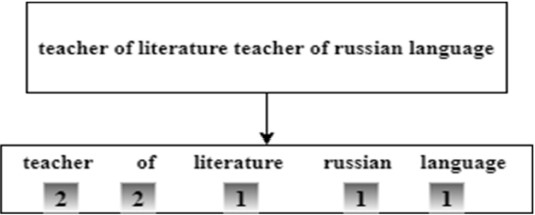
Figure 8. Representation of word frequencies as a vector using the “word bag model”.
For free-form answers, the bag of words vectorization model was used [28]. After transformations, a corpus (structured data representation) appears in the form of (((2, 1), (3, 1), (4, 1), (5, 1), (6, 1)) : : : ), in which each tuple of an array is a word. The first element of the tuple is the unique identifier of the word; the second element is the number of words used. In this step, cell N is run to create a corpus and dictionary for the LDA algorithm.
The Latent Dirichlet allocation (LDA) is applied to planar vector representations. It belongs to a family of generating probabilistic models in which topics are represented by the probabilities of each word from a given set. Documents, in turn, can be represented as combinations of these topics. A unique feature of LDA models is that topics do not have to be different and words can appear in several topics; this gives some vagueness to defined topics, which can be useful for coping with the flexibility of the language (Figure 9). The three main inputs for the LDA [29] are vocabulary, corpus, and number of topics.
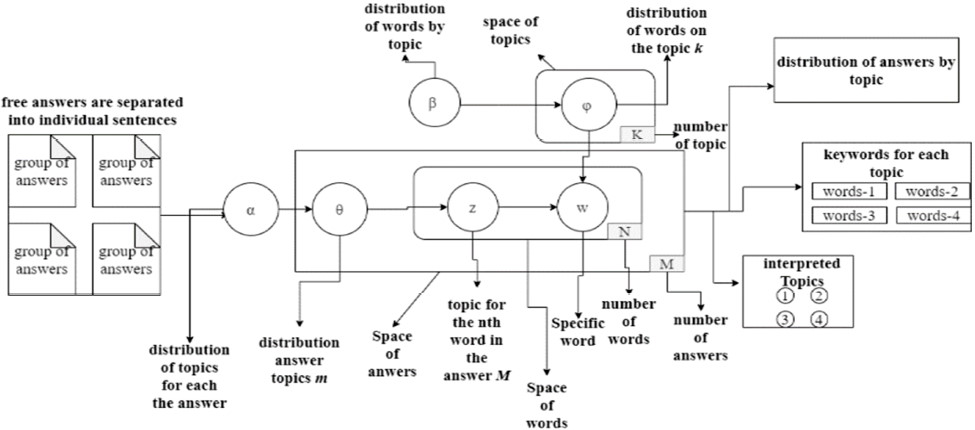
Figure 9. The algorithm of LDA.
The algorithm from the package (https://github.com/RaRe-Technologies/gensim) was used for question (1), the package (https://github.com/seanmowz/lda-topic-model) was applied to question (2). The Latent Dirichlet allocation method gives an observable word or lexicon by which it is possible to determine the probable theme, the distribution of words in each topic, and the combination of themes in the document. For the train LDA method run cells N, N.
The output of the LDA algorithm is the keywords for each topic. To assess how well the algorithm has worked, an expert assessment and a measure of coherence of the topics are needed, assessing how often the most likely words of the topic occur in a series of documents. The coherence of a topic is defined as the average common occurrence of two words for all pairs of the most likely words of the topic [14]. Co-occurrence is estimated as point-to-point mutual information (PMI) for documents in which both words occur. In the evaluation, the expert should highlight the following: in each topic, there are keywords relevant to a particular topic; after splitting the sentences into separate groups, the overall meaning of the topic is retained; in the keywords, there should be the most relevant to the group. The metric takes values from 0 to 1, the higher the metric value is the better it is. This metric shows how well a topic’s keywords set it apart from the rest of the topics.
After obtaining the topic model, it is required to distinguish free-form answers using the obtained model. Since the output of the LDA model is a correlation of each answer to a lot of class labels, an array of tuples is issued for each answer, where the first element is the topic number and the second is the membership of those.
Each free-form answer gets a probabilistic relation to the topic, but also for each topic, it is possible to display an array of tuples of keywords that also have a probability coefficient, [(0, ‘0.260 * “teacher” + 0.180 * “director” + 0.048 * “service” + 0.047 * “extracurricular” + 0.029 * “mediation” + 0.025 * “medical” + 0.024 * “hours” + 0.021 * “meals” + 0.016 * “duty” + 0.015 * “lesson”’), (1, ‘0.119 * “accompaniment” + 0.101 * “event” + 0.054 * “duty” + 0.047 * “director” + 0.030 * “camp” + 0.025 * “commission” + 0.022 * “summer” + 0.021 * “replacement” + 0.020 * “teacher” + 0.018 * “pedagogical” ’), (2, ‘0.100 * “lesson” + 0.065 * “participation” + 0.052 * “general education” + 0.045 * “teacher” + 0.043 * “competition” + 0.038 * “right” + 0.026 * “social network” + 0.025 * “training” + 0.024 * “organizer” + 0.023 * “public”’)], the first element of the tuple is the topic number, the second element is keywords with the probability of occurrence in the topic.
When showing keywords and complete sentences, it becomes possible to interpret the topic. In order to distribute answers by topic, the correlation is related to the topic, arrays are sorted, and the maximum coefficient is selected. If the interpretation is satisfactory to the expert, then it is possible to continue working with the data, if not, then return to stage A to review the data.
This methodology allowed the processing of the results of a federal survey of school psychologists in the education system. These results allowed the division of free-form answers into separate groups. Further, it is possible to group the data on individual questions of the questionnaire and conduct an in-depth analysis.
4. User Notes
To obtain the results presented in the paper, it is necessary to use the dataset from http://dx.doi.org/10.17632/m32kz6jjcx.1, which contains both the results of answers to open-ended questions and also a code that allows reproducing the described results. Detailed instructions for starting and configuring are presented in the following.
Main project requirements:
- Python version 3.6.7;
- Package manager pip (https://pip.pypa.io/en/stable/).
Create a virtual environment with the following commands for Windows:
- pip install virtualenv
- python3 -m venv env
- source env/Sctipts/activate
Create a virtual environment with the following commands for Linux:
- pip install virtualenv
- python3 -m venv env
- source env/bin/activate for linux
Install all requirements in the code root folder for question (1):
- pip install -r requimenst.txt
To run the project, use the following command:
- jupyter notebook
Main project requirements:
- Node.JS version 12 or newer;
- Package manager npm (https://www.npmjs.com/package/npm);
- Gulp task manager version 4 or newer (https://www.npmjs.com/package/gulp).
To install the dependencies, use the following command in the project directory:
- npm install
The initial data—the Word similarity graph dictionary and the data of psychologists’ answers—are placed into the/data directory. The files are named synonyms.csv and psychologists.json respectively.
To run the script sequence use command:
- gulp freeform: clusterize
A phased program execution is also possible. The following commands must be executed sequentially on the command line:
- freeform: retrieveData—the command retrieves answers to question (2) from the entire array of answers and saves them to temporary storage on disk
- freeform: preprocessData—splits sentences in one answer into separate answers, performs tokenization, removes punctuation, and stop words and brings words to normal form
- freeform: buildVocabulary—performs a search for synonyms applicable to answer texts, on the basis of which it builds a dictionary to replace words
- freeform: findFrequentSets—searches for clusters using the LDA algorithm, while excluding verbs, numerals, and tokens in the Latin alphabet
- freeform: outputClusters—outputs the clustering result to separate files into the directory/out
5. Conclusions
The paper describes a methodology for analyzing the results of mass web-based surveys with open-ended questions. Selected web-based survey tools based on the Digital Platform for Interdisciplinary Psychological Research, as a result of a mass survey, showed their effectiveness and promise for conducting federal-level research. The results can be used for web-based research using digital platforms.
Author Contributions: Conceptualization, E.N. and S.M. (Sergey Malykh); methodology, S.M. (Sergey Malykh); software, D.I., P.K., V.B., A.R., P.P., N.L., A.A., S.M. (Shamil Magomedov), I.Z., and V.I.; formal analysis, E.N., D.I., A.K., and A.S.; resources, S.M. (Sergey Malykh); data curation, S.M. (Sergey Malykh), E.N., D.I., A.K., P.K., and A.S.; writing—original draft preparation, E.N., V.B.; writing—review and editing, D.I., P.K., V.B., A.R., P.P., A.S., N.L., A.A., S.M. (Shamil Magomedov), A.K., I.Z., V.I., and S.M. (Sergey Malykh); visualization, D.I., P.K., and V.I.; supervision, S.M. (Sergey Malykh); project administration, E.N. and S.M. (Sergey Malykh). All authors have read and agreed to the published version of the manuscript.
Funding: This research was funded by the Ministry of Science and Higher Education of the Russian Federation.
Conflicts of Interest: The authors declare no conflict of interest.
References
- Krosnick, J.A. Survey research. Annu. Rev. Psychol. 1999, 50, 537–567. [CrossRef] [PubMed]
- Roberts, M.E.; Stewart, B.M.; Tingley, D.; Lucas, C.; Gadarian, S.K.; Albertson, B.; Rand, D.G.; Leder-Luis, J. Structural Topic Models for Open-Ended Survey Responses. Am. J. Political Sci. 2014, 58, 1064–1082. [CrossRef]
- Hays, R.D.; Liu, H.; Kapteyn, A. Use of Internet panels to conduct surveys. Behav. Res. Methods 2015, 47, 685–690. [CrossRef] [PubMed]
- Nikulchev, E.; Kolyasnikov, P.; Ilin, D.; Kasatonov, S.; Biryukov, D.; Zakharov, I. Selection of Architectural Concept and Development Technologies for the Implementation of aWeb-Based Platform for Psychology Research. Adv. Intell. Syst. Comput. 2019, 858, 672–685. [CrossRef]
- Keusch, F. Why do people participate in Web surveys? Applying survey participation theory to Internet survey data collection. Manag. Rev. Q. 2015, 65, 183–216. [CrossRef]
- Das, M.; Ester, P.; Kaczmirek, L. (Eds.) Social and Behavioral Research and the Internet: Advances in Applied Methods and Research Strategies; Routledge, Taylor and Francis Group: Oxfordshire, UK, 2018.
- Barakhnin, V.B.; Duisenbayeva, A.N.; Kozhemyakina, O.; Yergaliyev, Y.N.; I Muhamedyev, R. The automatic processing of the texts in natural language. Some bibliometric indicators of the current state of this research area. J. Phys. Conf. Ser. 2018, 1117, 012001. [CrossRef]
- Buenaño-Fernández, D.; Gonzalez, M.; Gil, D.; Luján-Mora, S. Text Mining of Open-Ended Questions in Self-Assessment of University Teachers: AnLDA Topic Modeling Approach. IEEE Access 2020, 8, 35318–35330. [CrossRef]
- Kochedykov, D.; Apishev, M.; Golitsyn, L.; Vorontsov, K. Fast and Modular Regularized Topic Modelling. In Proceedings of the 21st Conference of FRUCT Association, Helsinki, Finland, 6 November 2017; pp. 182–193.
- Jasim, M. Building Cross-Platform Desktop Applications with Electron; Packt Publishing Ltd.: Birmingham, UK, 2017.
- Pietsch, A.-S.; Lessmann, S. Topic modeling for analyzing open-ended survey responses. J. Bus. Anal. 2018, 1, 93–116. [CrossRef]
- Blei, D.M.; Ng, A.Y.; Jordan, M.I. Latent dirichlet allocation. J. Mach. Learn. Res. 2003, 3, 993–1022.
- Finch,W.H.; Finch, M.E.H.; McIntosh, C.E.; Braun, C. The use of topic modeling with latent Dirichlet analysis with open-ended survey items. Transl. Issues Psychol. Sci. 2018, 4, 403–424. [CrossRef]
- Maier, D.; Waldherr, A.; Miltner, P.; Wiedemann, G.; Niekler, A.; Keinert, A.; Pfetsch, B.; Heyer, G.; Reber, U.; Häussler, T.; et al. Applying LDA Topic Modeling in Communication Research: Toward a Valid and Reliable Methodology. Commun. Methods Meas. 2018, 12, 93–118. [CrossRef]
- Burnham, T. Coeescript: Accelerated Javascript Development; Pragmatic Bookshelf: Raleigh, NC, USA, 2015.
- Fain, Y.; Moiseev, A. Angular 2 Development with TypeScript; Manning Publications Co.: Shelter Island, NY, USA, 2016.
- Marani, F. Adding CSS/JavaScript to Our Django Project. In Practical Django 2 and Channels 2; Apress: Berkeley, CA, USA, 2019; pp. 179–203.
- Libby, A. Mastering PostCSS for Web Design; Packt Publishing Ltd.: Birmingham, UK, 2016.
- Campos, U.F.; Smethurst, G.; Moraes, J.P.; Bonifacio, R.; Pinto, G. Mining Rule Violations in JavaScript Code Snippets. In Proceedings of the 2019 IEEE/ACM 16th International Conference on Mining Software Repositories (MSR), Montréal, QC, Canada, 26–27 May 2019; pp. 195–199.
- Nikulchev, E.; Ilin, D.; Belov, B.; Kolyasnikov, P.; Kosenkov, A. e-Learning Tools on the Healthcare Professional Social Networks. Int. J. Adv. Comput. Sci. Appl. 2019, 10, 29–34. [CrossRef]
- Tomasdottir, K.F.; Aniche, M.; Van Deursen, A. The Adoption of JavaScript Linters in Practice: A Case Study on ESLint. IEEE Trans. Softw. Eng. 2018, 46, 863–869. [CrossRef]
- Mardan, A. Getting Node.js Apps Production Ready. In Practical Node.js; Springer Science and Business Media LLC.: Berlin/Heidelberg, Germany, 2018; pp. 331–364.
- Agocs, A.; Le Go, J.-M. A web service based on RESTful API and JSON Schema/JSON Meta Schema to construct knowledge graphs. In Proceedings of the 2018 International Conference on Computer, Information and Telecommunication Systems (CITS), Colmar, France, 11–13 July 2018; pp. 1–5.
- Izquierdo, J.L.C.; Cabot, J. JSONDiscoverer: Visualizing the schema lurking behind JSON documents. Knowl. Based Syst. 2016, 103, 52–55. [CrossRef]
- Yigitbas, E.; Anjorin, A.; Jovanovikj, I.; Kern, T.; Sauer, S.; Engels, G. Usability Evaluation of Model-Driven Cross-Device Web User Interfaces. In Proceedings of the Agreement Technologies; Springer Science and Business Media LLC.: Berlin/Heidelberg, Germany, 2018; pp. 231–247.
- Sabaren, L.N.; Mascheroni, M.A.; Greiner, C.L.; Irrazá, L. A systematic literature review in cross-browser testing. J. Comput. Sci. Technol. 2018, 18, 18–27.
- Wallach, H.M. Topic modeling: Beyond bag-of-words. In Proceedings of the 23rd International Conference on Machine Learning, Pittsburgh, PA, USA, 25–29 June 2006; pp. 977–984.
- Mehrotra, R.; Sanner, S.; Buntine, W.; Xie, L. Improving LDA topic models for microblogs via tweet pooling and automatic labeling. In Proceedings of the 36th International ACM SIGIR Conference, Dublin, Ireland, 26 December 2013; p. 889.
- Mimno, D.;Wallach, H.M.; Talley, E.; Leenders, M.; McCallum, A. Optimizing semantic coherence in topic models. In Proceedings of the Conference on Empirical Methods in Natural Language Processing, Edinburgh, UK, 27–31 July 2011; Association for Computational Linguistics: Stroudsburg, PA, USA; pp. 262–272.
Комментарии
Добавить комментарий